Samantha Gregory
How Do I Monitor Progress?
1. Establish a Baseline
For each student whose progress will be evaluated a baseline must be established, and this should happen before any change in instruction. A teacher should use the same probe that will be used throughout the intervention or evaluation period. Probes should be quick, easy to administer and measure the same skill each time. A few examples include a one‑minute oral reading fluency probe, timed writing for correct word sequences and frequency count of an identified behavior. Give the probe three times and take the median of the three scores for a more accurate baseline.
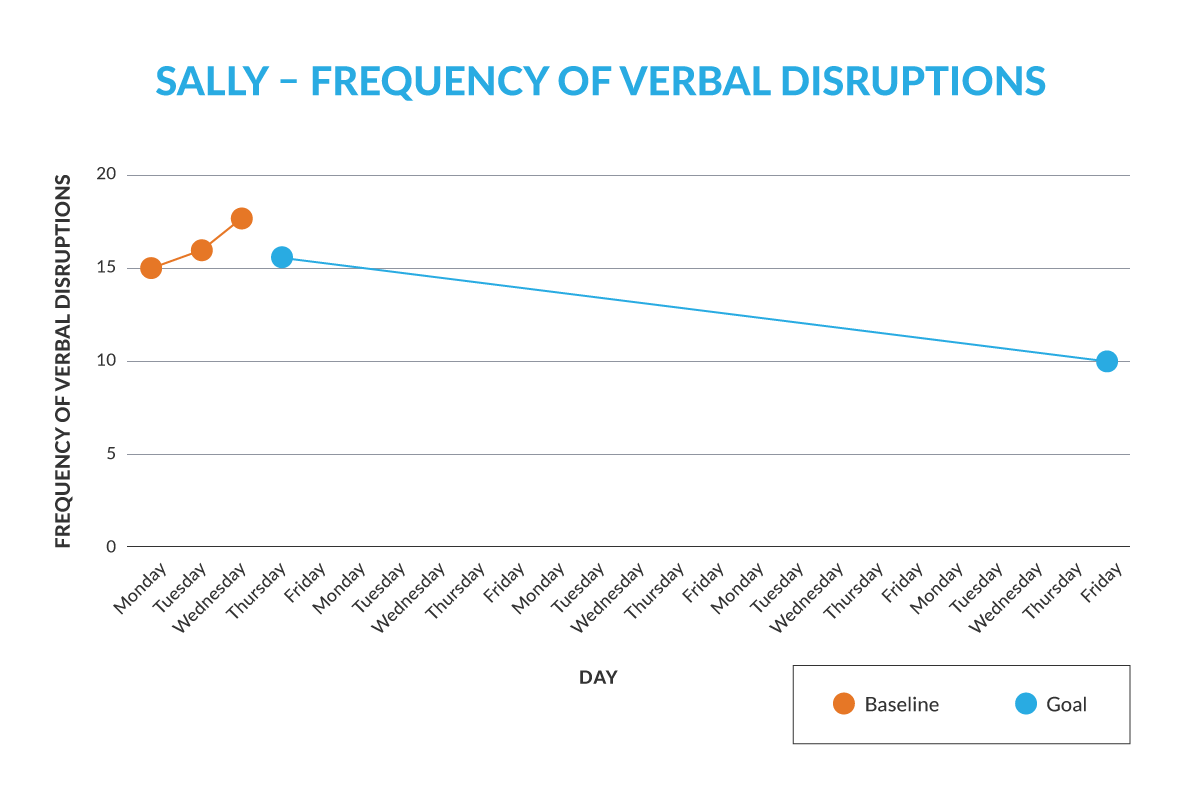
An example of determining a behavior baseline: Sally’s teacher Ms. Jones is conducting a Functional Behavior Assessment (FBA) for Sally’s verbal disruption, including yelling, screaming and crying. Before implementing a Behavior Intervention Plan (BIP) based on the results of the FBA, Ms. Jones collects data for three days on how frequently Sally engages in verbal disruption. Ms. Jones counts 15 verbal disruptions on Monday, 16 on Tuesday and 18 on Wednesday. Based on the median of the data from the three collection days, Sally’s baseline before the BIP is implemented is 16 verbal disruptions per school day.
2. Set a Goal
Once a baseline has been established, set a goal that takes into consideration the expected rate of progress for the student, the student’s current baseline level and peer expectation for the same skill. For behavior progress monitoring, incorporate the goal into a BIP based on what you learned about the function of the behavior in an FBA. The baseline and goal can be plotted on a line graph. Connect the two data points to form a goal line.
For example, Ms. Jones, in collaboration with the FBA and BIP team, sets a goal of Sally reducing her verbal disruptions over eight weeks from 16 per day to 10 per day (rate of 0.75 fewer verbal disruptions per week).
3. Implement One Instructional Change
Once a goal has been set, the intervention or change in instruction should be implemented. Only one change should be made to instruction so that the team can say the specific change in the student’s instruction made a difference for the student. During the intervention period a probe (the same measurement tool used to collect baseline data) should be given and plotted on the graph. The more intensive the intervention, the more frequently probes should be given. Generally, academic goals will have one to two probes per week, whereas behavior data may be monitored daily.
For example, Ms. Jones implemented Sally’s behavior plan that included reading a social narrative about raising her hand to talk before each independent work task in addition to two 15-minute behavior instruction sessions per week. She gave Sally specific praise for maintaining an indoor voice level every three minutes during independent work. Each Tuesday and Thursday, Ms. Jones monitored the frequency of Sally’s verbal disruptions and plotted them on the graph.
4. Make a Data-driven Decision
As a best practice, educators should implement an instructional change and revisit it after a designated time frame or make a change if they believe the intervention is not successful. With progress monitoring, data collected can be analyzed and used to determine whether or not a change should be made based on the student’s progress toward the identified goal.
Progress can be analyzed after at least four weeks of intervention or after the length of time determined by the intervention team. This time frame provides the opportunity for students to be exposed to and respond to intervention, and it also provides time for the team to collect enough data points to show a trend. Intervention data points should be compared to the previously established goal line to lead to one of four observations with associated decisions*:
- The data collected is too inconsistent to determine student progress toward the goal; review and re-evaluate the behavior plan to determine whether more time is needed to make a decision.
- The student is not on track for meeting the goal; review and re-evaluate the behavior plan to determine whether a change in intervention is needed.
- The student is progressing faster than anticipated; review and re-evaluate the behavior plan to determine whether a change might be needed.
- The student has made adequate progress toward meeting the goal; no instructional change is needed. Review and re-evaluate the behavior plan and continue progress monitoring.
*Note: Although academic goals wouldn’t involve a BIP, the team still needs to review and re‑evaluate them.
For example, after four weeks of implementing Sally’s Behavior Intervention Plan, Ms. Jones looks at Sally’s progress monitoring graph. While Ms. Jones believes Sally’s behavior has improved, her data suggests that Sally is not making enough progress needed to reach her goal of 10 verbal disruptions per day following eight weeks of BIP implementation. Instead of changing the goal or keeping the same instruction for the remaining four weeks and looking for more improvement, Ms. Jones meets with the team, and they decide to increase Sally’s behavior instruction from 15 minutes two times a week to 20 minutes three times a week.
By following the four steps to progress monitoring—establishing a baseline, setting a goal, making one instructional change at a time and arriving at a data-driven decision—educators can proactively ensure students meet their intended goals for academic and behavior success. Because it eliminates guesswork regarding their progress and helps maximize their chances for positive outcomes, progress monitoring is good for all learners. Set clear expectations and goals and watch your students grow throughout the school year!